Is China Still the Best Manufacturing Hub in 2026? A Data-Driven Analysis
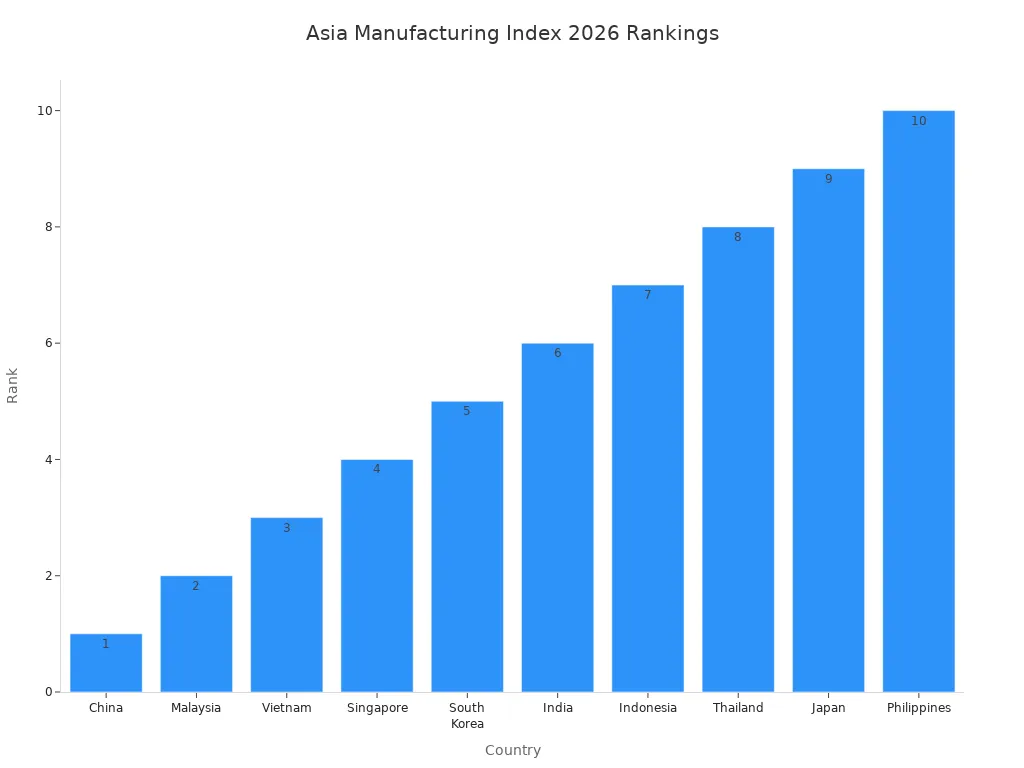
You see China lead the Asia Manufacturing Index for 2026, holding the top spot among competitors. This leadership, shown in the chart below, highlights why you still view China as the Best Manufacturing hub today.
Key Takeaways
China leads the Asia Manufacturing Index in 2026, showcasing its unmatched industrial scale and resilience.
Strong growth in sectors like electronics and new energy vehicles highlights China's shift towards advanced manufacturing.
While China remains the top hub, consider labor costs and supply chain risks when choosing a manufacturing location.
China's Manufacturing Status
Output and Growth Trends
You see China's manufacturing sector continue to deliver strong results as you move into 2026. The country posted a 5.9% annual growth rate in manufacturing output for 2025, signaling a robust recovery after global disruptions. This growth reflects China's ability to adapt and innovate, even when facing economic headwinds.
Year | Annual Growth Rate (%) |
|---|---|
2022 | N/A |
2023 | N/A |
2024 | N/A |
2025 | 5.9 |
2026 | N/A |
You notice that several high-growth sectors drive this momentum:
Electronics: Integrated circuits now lead as the top export, with a 47.7% year-over-year increase.
New Energy Vehicles (NEVs): Exports reached about 480,000 units in January 2026, up 52% from the previous year.
High-Tech Manufacturing: Products like electric vehicles and solar panels show double-digit growth, outpacing traditional sectors.
These trends show you that China is not just recovering but also shifting toward advanced, value-added manufacturing. This shift helps you understand why many still consider China the Best Manufacturing hub for both established and emerging industries.
Asia Manufacturing Index Leadership
You find China ranked first in the 2026 Asia Manufacturing Index, maintaining its leadership for the third year in a row. The Index, which benchmarks 11 major Asian economies across 43 parameters, highlights China's unmatched industrial scale and resilience. Even as Malaysia rises to second place and Vietnam moves to third, China's position remains secure.
Key factors behind this leadership include:
Nearly 30% of global manufacturing output comes from China.
Over 10,000 component suppliers form a deeply integrated supply chain.
Strategic investments in advanced technologies boost manufacturing capabilities.
Note: The scale and depth of China's manufacturing ecosystem continue to attract global businesses, even as geopolitical tensions rise.
You see that the Best Manufacturing environment in Asia still centers on China, thanks to its size, supply chain integration, and technological edge.
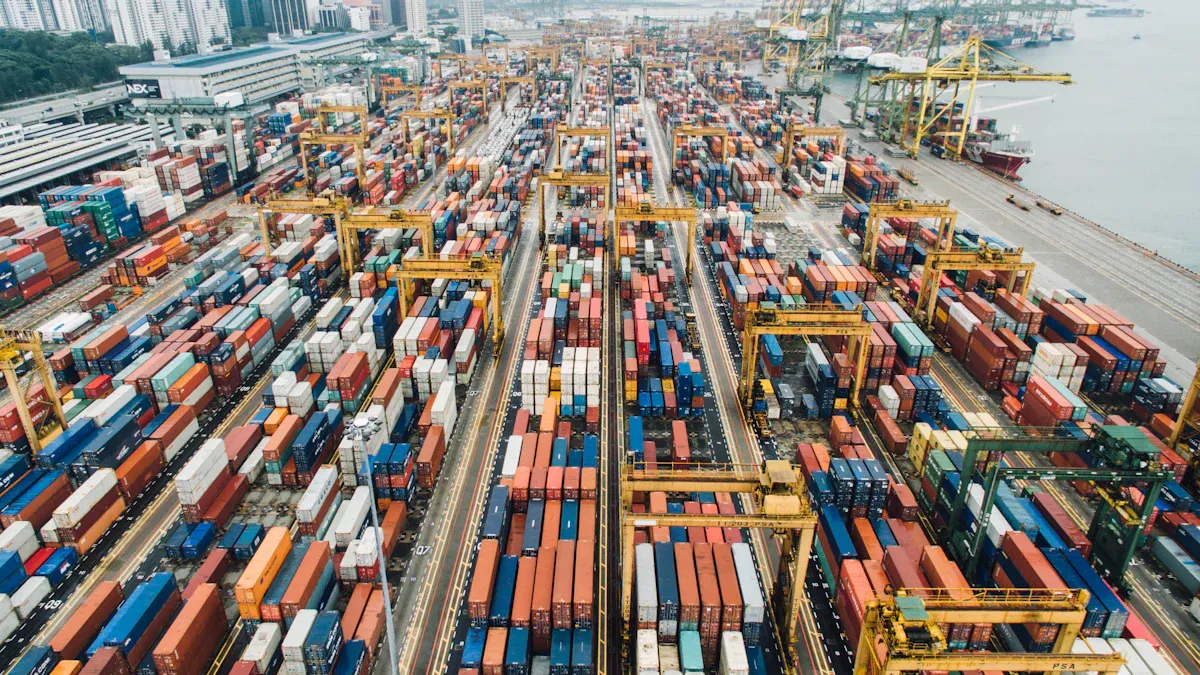
Global Market Share
You observe that China holds a dominant share of global manufacturing exports. In 2024, China accounted for more than 20% of global export flows for industrial goods. The country stands as the largest exporter in nearly 60% of product categories worldwide.
Since 1980, China's manufacturing output has grown from about $134 billion to $4.8 trillion in 2023. Its share of global manufacturing output has climbed from 5% to around 30%. During the same period, the United States saw its share drop from 21% to 17%.
China: 1st in Asia Manufacturing Index
Malaysia: 2nd
Vietnam: 3rd
You can see that China's global market share and export leadership reinforce its reputation as the Best Manufacturing hub. This dominance comes from decades of investment, innovation, and supply chain development.
Competitiveness Factors
Labor and Workforce
You face a changing labor landscape in China. While labor costs remain higher than in Vietnam or India, you benefit from greater productivity and a workforce that continues to upskill. Investments in workforce development and local supply chains help you access talent for advanced manufacturing, such as automation and electric vehicles. The table below compares average manufacturing labor costs in 2026:
Country | Labor Costs Description |
|---|---|
China | Higher, offset by productivity |
Vietnam | Roughly half of China’s wage levels |
India | Often the lowest cost option, especially at scale |
Mexico | Higher than Asia but lower than US, balanced by logistics |
Supply Chain Strength
You rely on China’s supply chain infrastructure for resilience and adaptability. The CBEC Pilot Zone reduces negotiation and information costs, especially for non-state-owned exporters. Improved transportation and e-commerce clusters lower disruption rates, even with U.S. customers. However, you must also manage risks:
Geopolitical fragmentation and trade tensions
Economic instability and demand fluctuations
Workforce shortages in logistics and procurement
Critical material dependencies, such as lithium and semiconductors
Regulatory complexities
Note: China’s dense supplier networks and rapid problem-solving capabilities set it apart from other manufacturing hubs.
Technology and Innovation
You see China invest heavily in automation and innovation. Between 2022 and 2024, venture capital funding in additive manufacturing reached $1.95 billion. China’s share of global industrial robotics exports rose to 16.7% in 2024. The additive manufacturing market grew at a 27% CAGR, more than double the global average. You also notice plans for $137 billion in robotics and high-tech industries, keeping China at the forefront of Best Manufacturing practices.
Policy and Incentives
You observe new policies that focus on technology and domestic demand. The government’s 2026 strategy aims to boost factory efficiency and global competitiveness. Export VAT rebates for solar PV and battery products will phase out, signaling a shift toward strengthening the domestic market. Compared to Vietnam, India, and Mexico, you find China’s manufacturing ecosystem offers unmatched supplier networks and managed dependence through the “China+1” strategy.
Best Manufacturing Hub Comparison
Vietnam Overview
You see Vietnam emerge as a strong contender in the global manufacturing landscape in 2026. The country posts impressive growth, with manufacturing production rising by 23.60% in January 2026 compared to the previous year. Over the past decade, you notice an average annual growth rate of 9.44%. Projections suggest that growth will stabilize near 7.00% by the end of the first quarter and around 5.00% in 2027.
When you consider Vietnam as a manufacturing hub, you benefit from several advantages:
Lower labor costs than China or Mexico
A skilled and growing workforce
Strategic location near major shipping routes
Favorable trade agreements with the US, EU, and Asia-Pacific partners
Political stability that supports long-term investment
New opportunities created by global companies shifting supply chains
However, you also face challenges in Vietnam. Infrastructure remains underdeveloped, with limited roads and ports. Logistics costs are high, making up 16-17% of GDP. You depend heavily on imported materials, especially in textiles, where over half of raw materials come from China. The regulatory environment can be complex, with lengthy tax and legal procedures that slow business operations.
Tip: If you prioritize cost savings and access to a skilled workforce, Vietnam offers strong potential, but you must plan for infrastructure and supply chain risks.
India Overview
You watch India’s manufacturing sector expand, driven by rising domestic demand and policy support. In 2025, India’s manufacturing growth rate reaches 3.5% year-on-year. Industrial output continues to rise, even as China faces weaker retail sales growth. India’s government encourages supply chain diversification, attracting companies in electronics, pharmaceuticals, and automotive sectors.
India’s strengths include:
A large and youthful workforce
Expanding domestic market
Policy incentives for foreign investment
Growth in high-value sectors
Despite these advantages, you encounter several obstacles:
Land acquisition bottlenecks due to fragmented records
Delays in labor reforms, causing uncertainty for manufacturers
Infrastructure gaps and high logistics costs
Shortage of skilled labor, with only 4.1% of workers having formal technical training
Stricter environmental compliance, raising costs in some industries
Fragmented supply chains and heavy reliance on imports
Potential impacts from new US tariffs on exports
Note: India’s manufacturing sector shows promise, but you must navigate regulatory and infrastructure hurdles to achieve the Best Manufacturing outcomes.
Mexico Overview
You see Mexico gain momentum as a manufacturing hub, especially for companies serving the US market. Labor costs in Mexico average $4.50 per hour in 2023, lower than China’s $6.50 per hour. Productivity continues to improve, making Mexico ideal for cost-sensitive production. Nearshoring trends drive growth in automotive and aerospace sectors, as US companies relocate production closer to home.
Mexico’s advantages include:
Proximity to the US and Canada, reducing shipping times and costs
Competitive labor costs with improving productivity
Strong presence in automotive, aerospace, and electronics
Participation in trade agreements like USMCA
You also face some challenges in Mexico:
Security concerns in certain regions
Infrastructure gaps outside major industrial corridors
Exposure to US economic cycles
Tip: If you need fast access to North American markets, Mexico provides a strategic location for Best Manufacturing, but you should assess regional risks.
Comparative Data
You compare China, Vietnam, India, and Mexico using key metrics and industry trends. The table below summarizes important factors for your decision-making:
Country | Labor Cost (2023) | Productivity | Growth Rate (2025/2026) | Key Sectors | Main Challenges |
|---|---|---|---|---|---|
China | $6.50/hr | High in tech | 5.9% (2025) | Electronics, NEVs, Solar | Rising costs, trade tensions |
Vietnam | Lower than China | Improving | 23.6% (Jan 2026), ~7% proj. | Electronics, Textiles | Infrastructure, import reliance |
India | Lowest in Asia | Mixed | 3.5% (2025), 7.5-7.8% proj. | Pharma, Auto, Electronics | Land, labor, logistics |
Mexico | $4.50/hr | Improving | Growing (nearshoring) | Auto, Aerospace, Electronics | Security, infrastructure |
When you choose a manufacturing location in 2026, you focus on workforce planning, technology investments, and agile supply chain management. You also consider infrastructure, proximity to customers, and long-term project planning. Each country offers unique strengths:
China leads in scale, supply chain depth, and innovation, making it the Best Manufacturing hub for high-tech and complex products.
Vietnam attracts you with cost savings and a skilled workforce, but you must manage infrastructure and supply chain risks.
India offers a large market and policy support, but you face regulatory and logistics challenges.
Mexico provides nearshoring advantages for North American markets, with competitive costs and improving productivity.
You must align your strategic goals with the strengths and weaknesses of each location to achieve the Best Manufacturing outcomes in 2026.
Challenges for China
Labor and Demographics
You face a shrinking workforce as China’s population ages. This demographic shift reduces the number of available workers and increases wage pressure across the manufacturing sector. The table below highlights the main impacts:
Impact on Manufacturing Workforce | Description |
|---|---|
The aging population leads to a smaller workforce available for manufacturing jobs. | |
Increased Wages | As the labor pool shrinks, wages in the manufacturing sector are expected to rise. |
Decreased Profitability | Higher wages and reduced productivity contribute to lower profitability in manufacturing. |
You may also notice weaker demand for goods and services as older populations spend less. The pressure on pension and healthcare systems grows, and the global economy feels the effects of China’s slowing productivity. Labor shortages, especially during peak periods like Chinese New Year, can disrupt production and delay exports.
Economic and Cost Pressures
You encounter rising material costs and stricter safety standards, which squeeze profit margins. Many manufacturers now operate with single-digit or even negative margins. The removal of export tax rebates forces you to seek new income sources. Inflation and currency fluctuations add more uncertainty. For example, a stronger yuan boosts nominal GDP, but a weaker yuan can reduce it. Producer price deflation and mild consumer inflation create a volatile environment for planning and investment.
Rising costs slow capacity expansion.
In-line inspection requirements increase equipment expenses.
The anti-involution campaign aims to improve efficiency but limits new growth.
Geopolitical and Trade Risks
You must navigate a complex global trade landscape. Aggressive tariffs from the US and retaliatory measures from China increase costs and disrupt supply chains. Many countries have launched new trade defense measures against China, yet China’s export surplus continues to grow. European companies face stricter regulations and tougher competition from local firms. Export restrictions on critical raw materials, such as rare earth elements, add another layer of risk for high-tech industries.
Note: Provinces missing growth targets and slow sector recovery highlight the need for careful risk management as you plan your manufacturing strategy in China.
You see China maintain its lead as the best manufacturing hub in 2026, supported by strong data and global market share. You benefit from advanced supply chains and innovation. However, you must weigh rising costs and labor shifts. Consider your industry needs and risk tolerance before choosing your manufacturing location.
FAQ
What industries benefit most from manufacturing in China in 2026?
You see electronics, electric vehicles, and high-tech sectors thrive in China. These industries gain from advanced supply chains and strong government support.
How does China compare to Vietnam for small businesses?
You find China offers better infrastructure and supplier networks. Vietnam provides lower labor costs but faces challenges with logistics and material sourcing.
Should you worry about geopolitical risks when manufacturing in China?
You should monitor trade policies and tariffs. Geopolitical risks can impact costs and supply chains, so always plan for possible disruptions.
See Also
Enhance Productivity Using An OLED Power Display Indicator
Essential Considerations for Buying the Perfect Headlamp
Tracing Flashlight Development From History To Present Day
In-Depth Review of Helius W644 Rechargeable Spotlight Headlamp